Take the well-known twitter account, all1 of its tweets, and a diagram in which we carefully place the tweets on the two axes according to day and time of publication. The result:
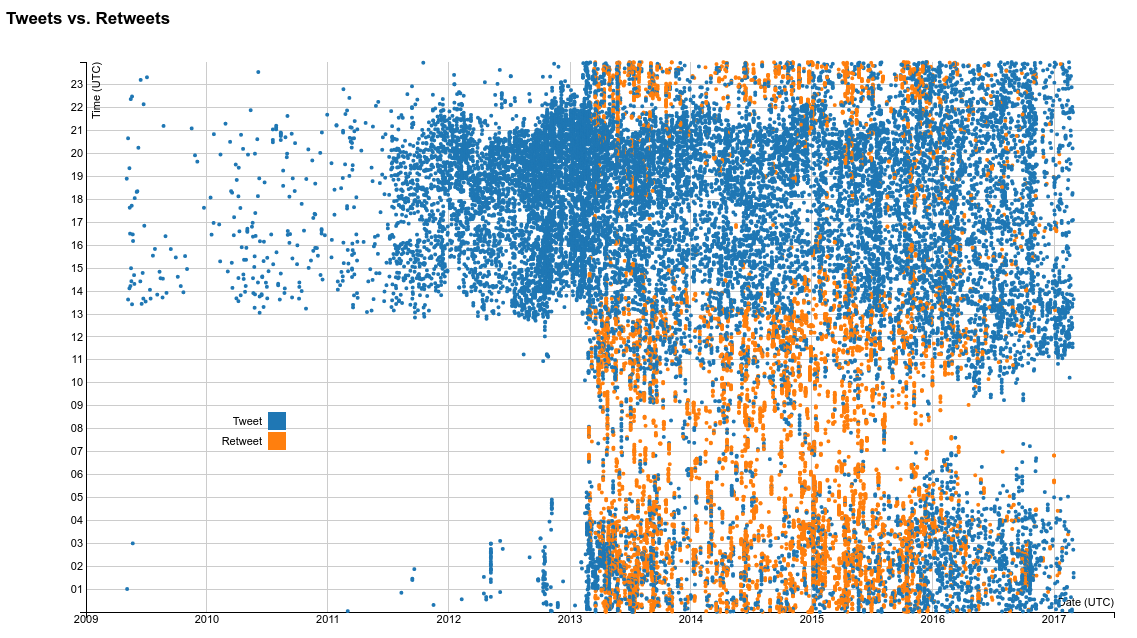
Pretty! Also, tweets and retweets are distinguished as well!
One might assume that Twitter did not introduce native retweets before 2013. Wrong! The have been available since 2009. Also, the data mainly contain “retweets” of this style:
"@RileyJSwanson: Donald is a stud. On Late Night w/ Jimmy Fallon tonight, he was sharp as a tack. @realDonaldTrump" Thanks.
— Donald J. Trump (@realDonaldTrump) February 27, 2013
Obviously, something changed according to the twitter usage in 2013. From then on, he’s an avid retweeter, mainly at night time2. The businessman’s regular tweets are still mainly published during business hours. What is also remarkable: The candidacy was announced in Juni 2015. Starting in the middle of 2015 the nightly retweet-orgies seem to thin out as well.
Just watching “The Celebrity Apprentice 5” and live-tweeting. Lol!
But behold! Our data offers so much more. We can also color the dots according to the client that has been used.
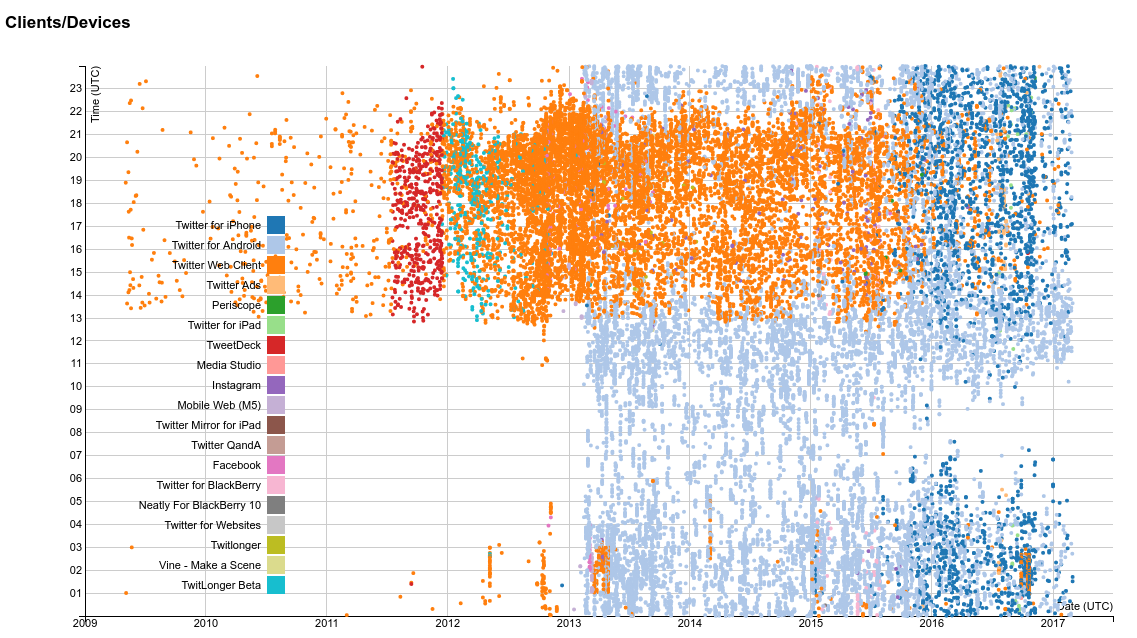
Oh boy, so many colors!
Let us have a look, shall we. In the beginning, only the web client / website is being used. He discovers TweetDeck in the middle of 2011, but replaces it with TwitLonger (Slogan: When you talk too much for Twitter) around christmas.
In 2013 he gets a new toy – an Android smartphone – which he uses to tweet and, as we learned before, retweet, at night. During business hours, the web client remains the client of choice, until it is replaced by an iPhone at the end of 2016. Or is that the apprentice who is tweeting? Some might think so.
There is one last pressing question: Does he sleep? Let’s compare that with an average person… well, I just have my own data:
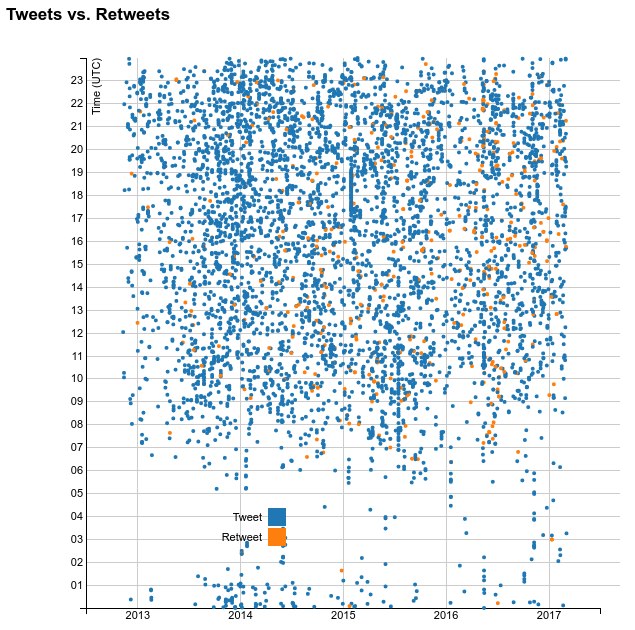
I have just been tweeting since 2013, sorry! ❤
So if he sleeps, his sleep is less consistent than mine. I should probably have that printed on a T-shirt.
Of course the diagrams are not only raster images, but also available as a dynamic visualization so you can play with them yourselves.
The dataset has been taken from the truly great Trump Twitter Archive. They also archive other politicians’ tweets.